

Before you assume your retention is bad, check what "bad" actually means. Most creators compare their number to a global average that doesn't match their video length, then panic over a number that was never a fair comparison in the first place. As of 2026, YouTube Studio's own retention report also uses updated labels that a lot of guides haven't caught up with yet.
YouTube audience retention is the percentage of your video the average viewer actually watches, tracked in YouTube Studio as average percentage viewed and average view duration. A realistic target depends on your video length and topic, not one fixed number, and the fastest way to move it is fixing your first 30 seconds.
This guide covers what a fair retention benchmark looks like by video length, how to read the current Key Moments report inside YouTube Studio, and the specific fixes that move the needle first.

Audience retention measures how much of your video the average viewer watches, shown in YouTube Studio under Analytics as two separate numbers. Average percentage viewed tells you what share of the video people watched on average. Average view duration tells you the raw minutes and seconds.
If your 10-minute video holds viewers to the 4-minute mark on average, your retention is 40%. Both numbers matter for different reasons. Percentage viewed tells you how well the video holds attention relative to its own length. View duration tells you the raw watch time YouTube's recommendation system credits you for.
You'll find both metrics, plus the moment-by-moment retention curve, inside YouTube Studio: Content > select a video > Analytics > Engagement tab.
There's no single percentage that counts as good. Retention drops as video length increases, almost every time, because every extra minute is another chance for a viewer to leave. A 30-minute video holding 35% can deliver far more total watch time than a 4-minute video holding 80%, and total watch time is what the recommendation system weighs most heavily.
The only fair comparison is against videos of similar length, which is exactly what YouTube Studio's own "typical retention" comparison line does for you on the retention graph.
These ranges reflect a synthesis of publicly available creator benchmark research. Treat them as a reference point, not a pass or fail line. Compare against your own channel's typical retention for videos of similar length first.
Content type shifts these numbers as much as length does. Structured how-to and tutorial content tends to hold viewers well through the first half, then drops as viewers who found their specific answer leave. Vlogs and personality-driven content rely on story and pacing rather than one informational payoff, which is why the vlog-specific tactics later in this guide matter more for that format than for tutorials.
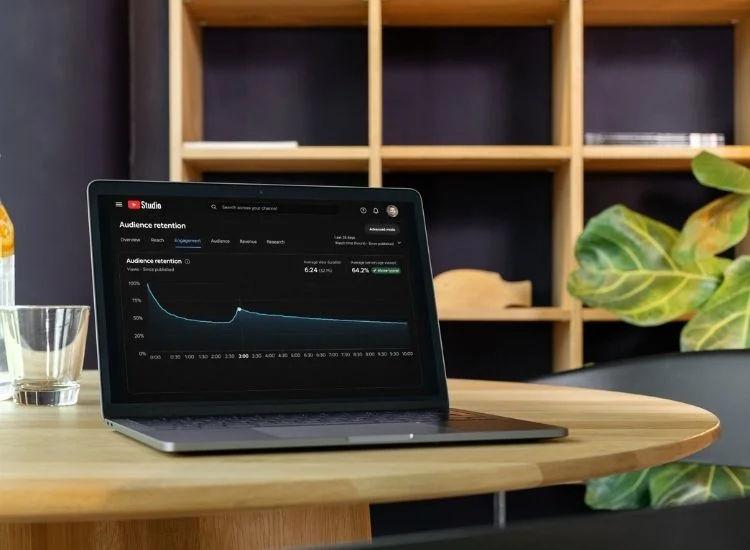
YouTube Studio's audience retention report labels four specific moments on your video's retention curve, and the terminology changed recently. If you learned this report a while back, the labels you learned then are outdated now.
The current official terms, per YouTube's Help Center documentation, are Intro, Top Moments, Spikes, and Dips (Source: Measure key moments for audience retention, YouTube Help, Google, 2026).
You can also filter this report by audience segment: new versus returning viewers, subscribers versus non-subscribers, and organic versus paid traffic. If new viewers bounce at the Intro while your subscribers stay, that points to a hook or title-match problem rather than a content problem.
Open this report within 48 hours of publishing for the freshest signal on how a new video is landing with viewers.
The Intro window carries more weight than any other single stretch of your retention curve, because it's where a viewer decides if the rest of the video is worth their time.
YouTube's own Creator Academy backs this up directly: videos with consistently high audience retention and watch time have the potential to show up more often in Search and Suggested locations on the platform. A weak Intro doesn't just cost you viewers in the first 30 seconds. It suppresses the recommendation signal for the rest of the video's life.
The usual causes of a steep Intro drop are predictable:
Fix the opening and you lift the entire curve. Retention rarely recovers what it loses in the first 30 seconds.

Fixing your first 60 seconds, tightening your pacing, and structuring the video so viewers always know what's next will move retention faster than any other change. Here are the seven strategies that consistently work.
Skip the intro music, the channel greeting, and the long setup. Get to the point immediately.
Your first 30 seconds should answer one question: why should I keep watching? Three formats work consistently:
Rambling is the single biggest retention killer in on-camera videos. When your delivery wanders, so does the viewer's attention.
Scripting your video, even loosely, keeps you focused and cuts the dead air your editor has to remove later. A teleprompter for video creators takes this further. It lets you deliver a script at a natural pace without losing your place, which cuts the stumbles and long pauses that wreck a retention curve.
Use the Speaking Speed Calculator to find your ideal pace. Most creators perform best at 130 to 150 words per minute on camera.
Creators notice the difference this makes to their pacing. A Teleprompter.com review calls out exactly this:
"I especially like the feature that allows the text to scroll at the exact pace that I'm speaking naturally instead of a fixed scroll speed. This is something very rare amongst Teleprompter apps." (enrique vanderhoff, App Store review, United States, August 2026)
Chapters serve two purposes: they help viewers navigate, and they signal to YouTube that your content is organized and intentional.
Add timestamps for any video over five minutes. At the start of longer videos, briefly tell viewers what's coming: first we'll cover X, then Y, then I'll leave you with Z. That roadmap reduces anxiety and keeps viewers through each section.
Split longer videos into natural 3 to 5 minute segments. Smaller units give viewers mental checkpoints and reduce the chance of a sharp mid-video Dip.
Static visuals and unbroken talking-head footage cause attention to drift. Change something on screen every 60 to 90 seconds.
Practical pattern interrupts include cutting to a second camera angle, adding a text overlay or graphic, cutting to B-roll, or dropping in a quick on-screen question. Each shift resets the viewer's brain, buying you another stretch of focused attention.
Cut anything that doesn't move the content forward directly. Long silences, repeated points, and improvised tangents are where viewers leave.
Run your script through the Script Readability Analyzer before you record to catch sections likely to drag. A tighter script leads to a tighter edit every time. Keep transitions clean, not flashy. Over-produced transitions pull attention away from the content itself.
In-video calls to action can boost engagement, but poorly placed ones interrupt the viewer experience.
Put your main CTA at a natural pause point in the middle of the video, not at the end where retention is already lower. A mid-video prompt like "drop your answer in the comments, I read every one" gives viewers a reason to engage without breaking momentum. Avoid stacking multiple CTAs in a short window. One well-placed prompt outperforms three awkward ones.
After every upload, spend five minutes reviewing the retention graph. Ask three questions: where did people leave and what was happening at that timestamp, where did retention spike and what caused it, and how did your Intro compare to your best-performing videos.
Apply these insights to your upcoming scripts. Creators who use retention metrics as a continuous learning loop level up much faster than those relying on guesswork.
Shorts operate on a completely different retention model than long-form video. Because Shorts loop automatically, average retention percentages run significantly higher, often in the 70 to 85% range. On Shorts, YouTube measures what percentage of viewers watch through to the end without swiping away, and loop completion feeds the algorithm directly.
Key differences worth knowing:
If you're using Shorts as a growth channel, treat each one like a 60-second pitch: single idea, fast pacing, satisfying end.

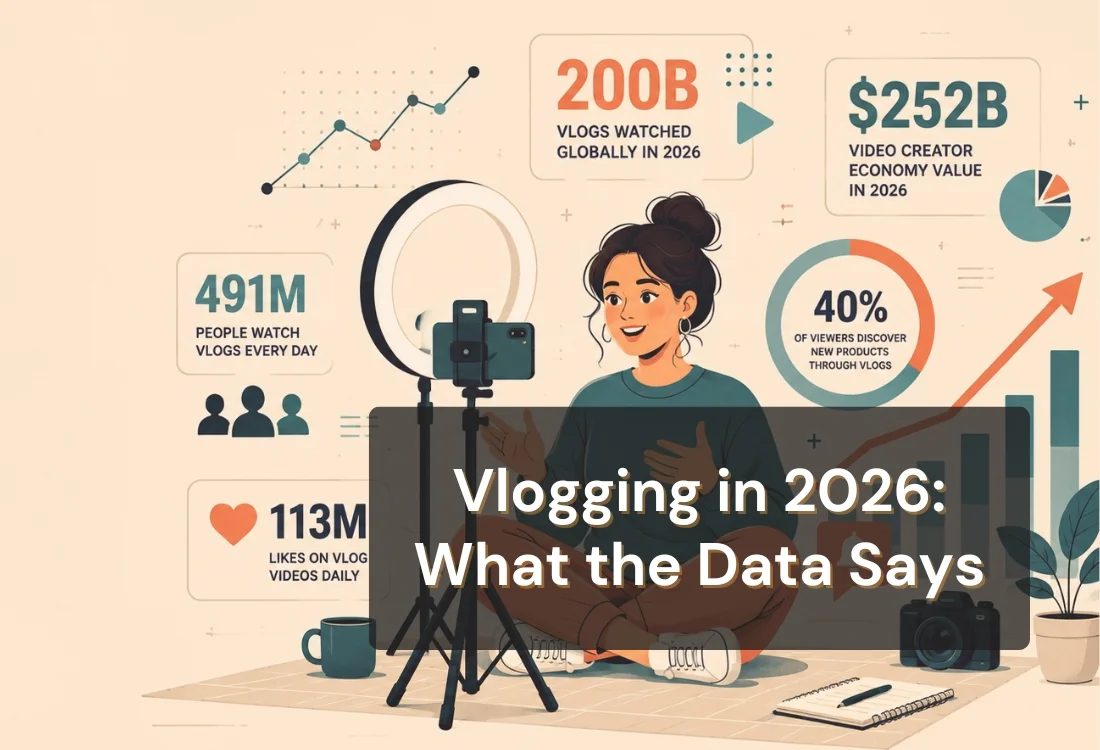
Vlogs face a retention challenge tutorials don't. They rely on personality and story structure rather than one informational payoff.
Effective vlogs focus on narrative storytelling over simple daily documentation. You can build clear characters, settings, conflict, and resolution using just a smartphone and a basic ring light.
Most retention problems trace back to five repeat mistakes:
Start with YouTube Studio. It has the retention graph, the Key Moments report, and audience segmentation by viewer type, device, and geography, all built in.
Set a habit: open the retention report within 48 hours of every upload, since that window gives the most signal-rich read on how a video is landing.
For comparative analysis once you've established your own baseline, third-party tools like TubeBuddy and VidIQ offer retention benchmarking against similar-length content in your niche.
Improving YouTube audience retention is a skill you build over time, not a single trick you apply once. Every retention graph is a lesson, and every video is a data point.
The creators who grow consistently aren't the ones with the best cameras. They're the ones who read their own graphs, tighten their delivery, and make the next video better than the last.
Fix your first 30 seconds. Tighten your pacing. Check your own data. Then do it again.
YouTube audience retention is the average percentage of a video that viewers watch before leaving. YouTube Studio tracks it as average percentage viewed and average view duration, alongside a moment-by-moment retention curve for each video.
There's no single good number. Retention naturally drops as video length increases, so a fair benchmark compares your video only to others of similar length. Roughly 60% or higher is strong for videos under 5 minutes, while 30 to 40% is solid for videos over 15 minutes.
These are the four official labels on the current Key Moments for audience retention report. Intro shows retention through the first 30 seconds. Top Moments mark stretches where almost nobody left. Spikes flag rewatched sections. Dips flag where viewers skipped ahead or left.
The most common causes are a slow or branded cold open, a hook that doesn't match the title or thumbnail, no clear value statement early on, and pacing that's too slow. Each shows up as a steep drop in the Intro portion of the retention graph.
Yes. Shorts loop automatically, so average retention percentages run much higher, often 70 to 85%. The metric that matters most for Shorts is loop completion, not percentage viewed in isolation.
Indirectly, but meaningfully. A teleprompter helps you deliver a script at a consistent pace with fewer stumbles and long pauses, which means less dead air in the edit and a tighter retention curve.


.png)


.png)