

LinkedIn has evolved beyond being merely a resume repository or recruiting platform. It is now increasingly functioning as a professional content network where video content competes for engagement with other formats such as carousels, documents, and standard text posts.
The most important 2026 implication is structural: LinkedIn’s product, creator incentives, and recommendation surfaces are actively shifting to accommodate more video, including vertical, mobile-native viewing experiences.
This article compiles the most recent, data-backed LinkedIn video statistics available as of February 2026, prioritizing first-party and quasi-first-party sources and anchoring engagement and year-over-year comparisons in large-scale third-party datasets. (This report explicitly states that it uses the latest findings from 2024 to 2025 as the best available benchmark window.)
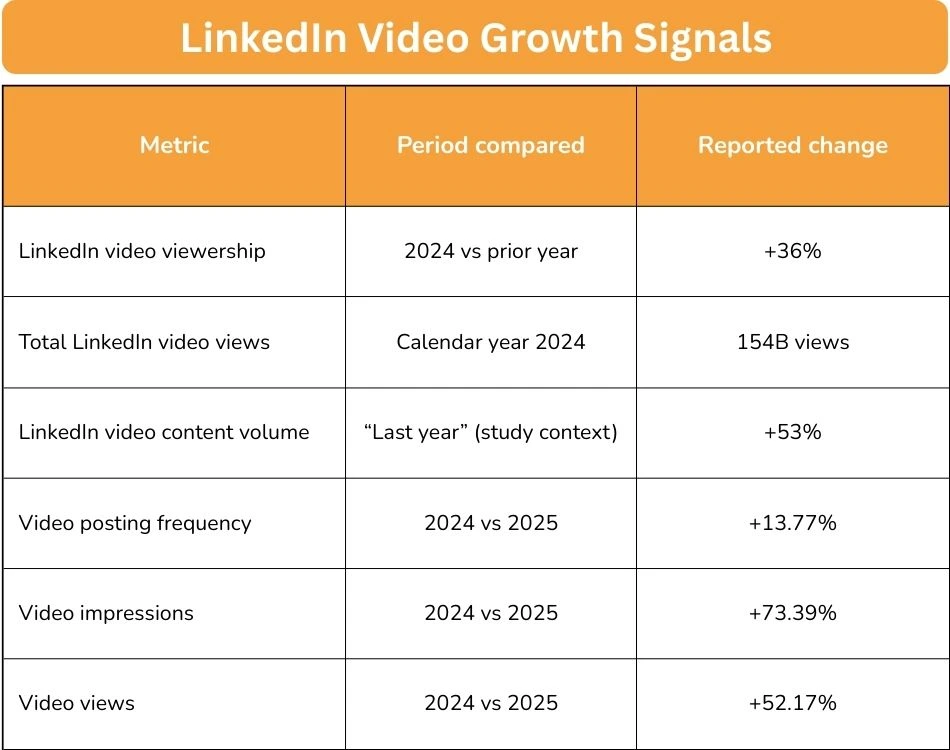
LinkedIn’s own research indicates video consumption is accelerating. In LinkedIn Creative Labs’ “The Art & Science of Video Storytelling,” the platform reports that video viewership on LinkedIn surged 36% in 2024, reaching 154 billion views, and that video posts are shared 20 times more than other content types.
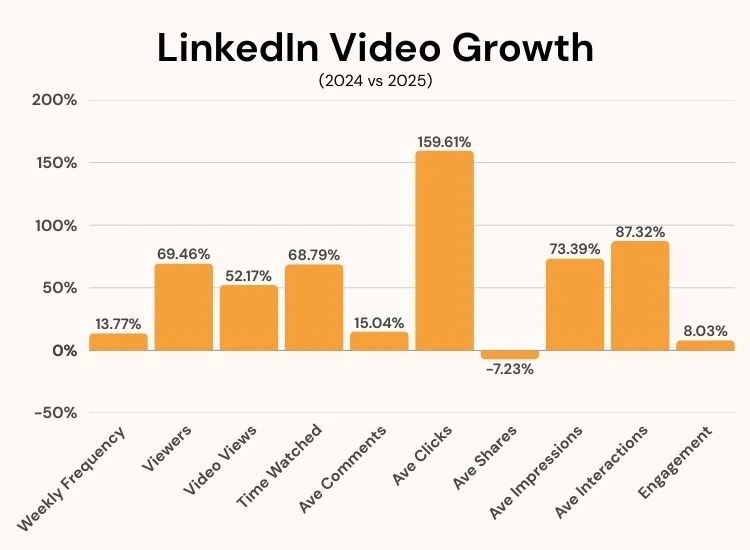
In 2025, larger cross-account studies show the growth is not only in consumption, but also in publishing volume and distribution. Metricool’s “LinkedIn Study 2025” reports 53% growth in LinkedIn video content in the last year.
More importantly for marketers measuring outcomes, Metricool shows that between 2024 and 2025, video posting increased 13.77%, while video impressions rose 73.39% and video views rose 52.17%, suggesting distribution and viewing are growing faster than publishing.
Video works on LinkedIn is no longer a generic statement. By 2026, what matters is how video performs relative to other LinkedIn-native formats in consistent, measurable benchmarks.
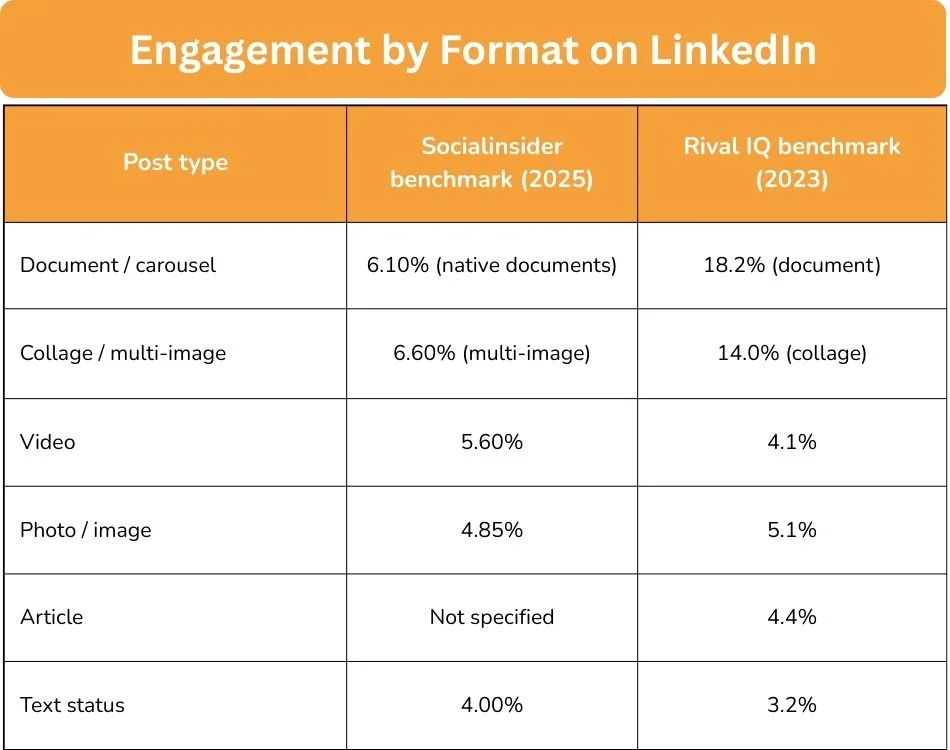
Socialinsider’s “2025 LinkedIn Benchmarks” (based on 1 million posts published over 2024) reports that by mid-2025, LinkedIn’s engagement rate by impressions stands at 5.20%, and that video posts average 5.60% engagement rate by impressions. In their ranking, multi-image posts lead (6.60%), followed by native documents (6.10%), then video (5.60%).
Rival IQ’s LinkedIn Benchmark Report (2023 dataset) provides a second benchmark lens and shows that engagement rate by impression varies sharply by post type. In that report, document posts (18.2%) and collages (14.0%) far exceed photo (5.1%), article (4.4%), video (4.1%), and text status updates (3.2%) for engagement-per-impression among the brands studied.
These two studies measure similar concepts but at different times and with different samples. The consistent strategic takeaway is that LinkedIn is a “format competition,” and video is competing most directly with carousels/documents and multi-image storytelling rather than replacing them.
For a LinkedIn video strategy, the most important demographic shift is not only age distribution. It is why people are on LinkedIn and what content norms they accept in a professional context.
LinkedIn Creative Labs explicitly notes Gen Z as the fastest-growing demographic on LinkedIn, and frames this cohort as influencing platform-wide attention behaviors: faster scrolls, shorter attention spans, and stronger demand for creative impact upfront.
For reach sizing, DataReportal’s 2025 essential LinkedIn stats report that data published in LinkedIn’s own advertising tools show LinkedIn ads reached 1.20 billion members in January 2025, while cautioning that ad reach is not the same as active users.
For total network scale, LinkedIn announced crossing 1 billion members in late 2023, as reported in a Reuters write-up carried by Yahoo Finance.
LinkedIn’s audience remains unusually “work-intent,” but the creative language for video is shifting closer to short, feed-native norms. The practical result: marketers in 2026 need to build for two simultaneous contexts.
One context is the “professional utility” expectation: educational explainers, expert takes, proof, and credibility signals.
The other is the “attention economy” expectation: short hooks, strong pacing, captions, and vertical-friendly framing. LinkedIn Creative Labs’ findings and recommendations strongly align with this mixed reality.
LinkedIn video success in 2026 is increasingly format-specific. Research highlights how mobile-first and vertical norms are changing what performs.
In the study, vertical video formats are associated with 34% higher engagement and 34% longer dwell times compared to traditional square-format brand awareness content. The report also indicates a 41% increase in engagement when popular culture references are used, with advertisements utilizing meme formats seeing an even greater uplift of up to 111%.
These results matter because they anchor vertical video on LinkedIn in measured outcomes rather than trend-chasing. They also support a broader hypothesis: LinkedIn’s algorithmic and UX surfaces are rewarding content that looks and feels native to mobile feed consumption.
If you are producing video for LinkedIn in 2026, a defensible format stack looks like this:
Native short video for feed discovery, using vertical or near-vertical framing when the message benefits from a “talking head plus captions” style, since face-to-camera and vertical-native behaviors appear supported by LinkedIn’s own creative effectiveness analysis.
Multi-image and document-style storytelling for deeper, swipe-based engagement, since third-party benchmarks consistently show these formats as top performers by engagement rate.
Video should not be treated as a replacement for “document carousels.” Instead, they should work together: video earns attention quickly, documents deepen consideration, and both benefit from educational positioning that LinkedIn audiences reward.
If your 2026 strategy includes paid distribution, two benchmark categories matter: creative effectiveness and measurement infrastructure.
LinkedIn Creative Labs’ study is explicitly based on 13,000+ B2B video ads and 550,000+ video frames, analyzed with LLMs and machine learning. Its central claim is that a large portion of outcomes is driven by creative decisions.
Within that work, it reports large lifts for specific creative approaches, including “Expert Takes” and “Human Touch,” plus the vertical and cultural-coding effects already noted. The practical implication is that “production value” is not the only lever; framing, message structure, and native cultural cues can materially shift engagement and dwell time.
LinkedIn’s Conversions API is documented as a server-to-server connection that helps advertisers measure campaign performance across conversion locations and use that data for optimization.
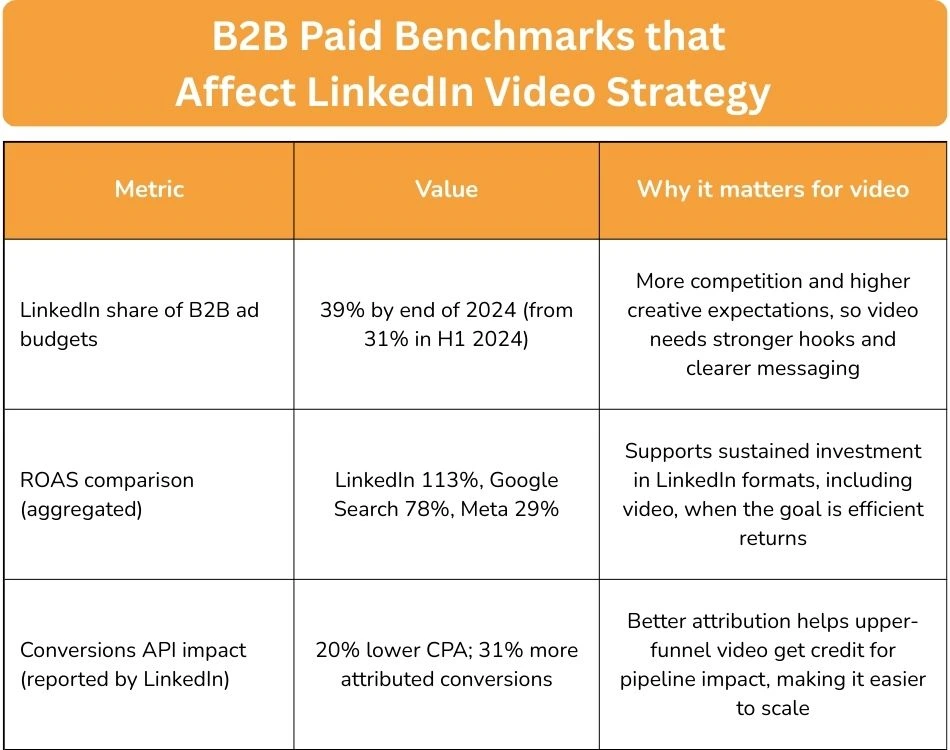
In 2025, Dreamdata’s benchmarks report cites LinkedIn’s own findings that Conversions API users see about 20% lower CPA and a 31% increase in attributed conversions compared to non-integrated users.
This matters for video because video often functions as upper-funnel demand creation. Better attribution and server-side measurement reduce the risk that video is undervalued simply because it influences later conversions rather than generating last-click wins.
Dreamdata’s 2025 LinkedIn Ads Benchmarks highlights that LinkedIn Ads’ share of total B2B ad budgets grew from 31% in H1 2024 to 39% by year-end, and reports LinkedIn generating the highest ROAS among major networks in their dataset (LinkedIn 113%, Google Search 78%, Meta 29%).
Video-ad-specific CTR and completion-rate benchmarks are not consistently published in open, first-party LinkedIn sources. Treat agency benchmark lists as directional unless you have your own campaign data. (Unspecified in official, public sources as of this report’s research window.)
Lead with high-performing, native formats. If your KPI is engagement, the strongest public benchmarks consistently favor multi-image, documents, and video as top tiers. In Socialinsider’s 2025 benchmarks, video’s engagement rate (5.60%) is competitive with the highest formats on the platform.
Design video for mobile-first consumption. LinkedIn’s own Creative Labs analysis links vertical formats and face-to-camera norms with higher engagement and longer dwell times, indicating that “talking head plus captions” is not only acceptable on LinkedIn but often aligned with what the platform’s audience and algorithm reward.
Treat video as a system, not a single asset. Metricool’s data suggests distribution and viewing growth are outpacing publishing growth, which typically signals an algorithmic window where fast learners gain outsized reach. In practical terms: test more video variants early in 2026, then consolidate into repeatable series once you find a format that wins.
Vertical video and creator distribution will keep expanding inside LinkedIn’s product surfaces, because the 2024 to 2025 growth pattern indicates LinkedIn is actively prioritizing video in recommendation and interface placement.
Creative distinctiveness will matter more than polish. LinkedIn Creative Labs explicitly frames creative choices as a major driver of video performance and highlights culturally fluent formats (memes, workplace cues, “real talk”) as performance levers.
Measurement quality will become a competitive advantage. As signal loss and privacy constraints continue to pressure attribution, server-side and first-party measurement pipelines (like Conversions API) will increasingly determine whether video works in dashboards, which in turn impacts budget decisions.
LinkedIn video has moved from an optional add-on to a core format for professional reach and persuasion. The platform is rewarding native, mobile-first video, and the best results come from aligning creative choices with how people actually consume content in-feed.
In 2026, the performance gap is less about production polish and more about clarity, pacing, and relevance. Marketers who pair short, attention-efficient video with strong measurement and a repeatable testing cadence will outperform teams that treat video as a one-off campaign asset.
Actionable recommendations for marketers
References:
LinkedIn Creative Labs (report PDF)
Socialinsider 2025 LinkedIn Benchmarks
Metricool LinkedIn Study 2025 (PDF)
Rival IQ 2023 LinkedIn Benchmark Report (PDF)
DataReportal Essential LinkedIn stats (2025)
Dreamdata 2025 LinkedIn Ads Benchmarks highlights
Reuters coverage of LinkedIn reaching 1B members (via Yahoo Finance)


.png)